Program: Clean Transit Access Program (CTAP) · Operator type: Medicaid ambulette (NEMT) · Location: Whitestone, Queens
Six Ford E-Transits at Green Trips, a Queens ambulette company, ran Medicaid wheelchair trips for 30 days with every mile tracked. Here is what the data says about range, charging, cost and emissions for a New York City Medicaid transportation fleet.
Download the case study (PDF)
Snapshot
Source: ZetiOS telematics, six Green Trips E-Transits, Sep 5 – Oct 4, 2026. Cost and emissions methods are in the sections below.
Your day, in miles
Most wheelchair trips in New York City are short. In August 2026, 82 NYC Medicaid transportation providers ran 51,694 wheelchair trip legs. A trip leg is one rider, one way.
- 70% of legs were 5 miles or less; 89% were under 10 miles. Only 1.3% were longer than 20 miles.
- The median van ran 3 legs and about 11 billed miles a day.
- Dialysis is the top trip reason for 64 of the 82 providers, and 48% of all legs are standing orders (recurring trips). Much of the day is known before it starts.
- The work sits in three boroughs (Brooklyn 33%, Queens 26%, Bronx 25% of pickups) and one block of the day: 79% of pickups happen between 8 AM and 1 PM. After 3 PM, fewer than 5% remain.
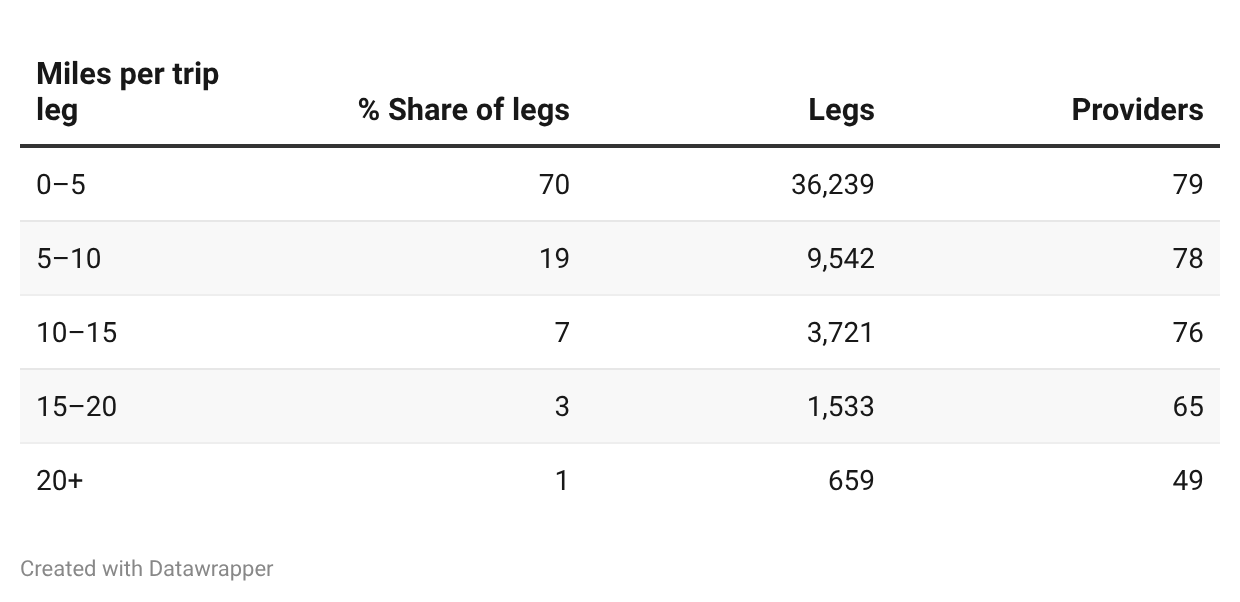
Source: NYS Department of Health Medicaid transportation data, NYC wheelchair trips, August 2026 (via MAS). "Billed miles" are the miles Medicaid paid for, pickup to drop-off; they don't include the drive to the pickup.
The range question
Will an electric van go the distance? Start with how far a van actually drives in a day.
Ford estimates 116 miles on a charge for the medium-roof E-Transit with the standard battery (108 miles for the high-roof model). Range changes with weather, upfits and battery age, so we plan on having less range: about 100 miles in mild weather, with room for the wheelchair lift, the A/C and an aging battery, and about 70 miles on a hard winter day.
Across 17,671 van-days in August 2026, billable miles per van per day were: median 11, 95th percentile 33, and 99.9% of van-days under 70 billed miles.
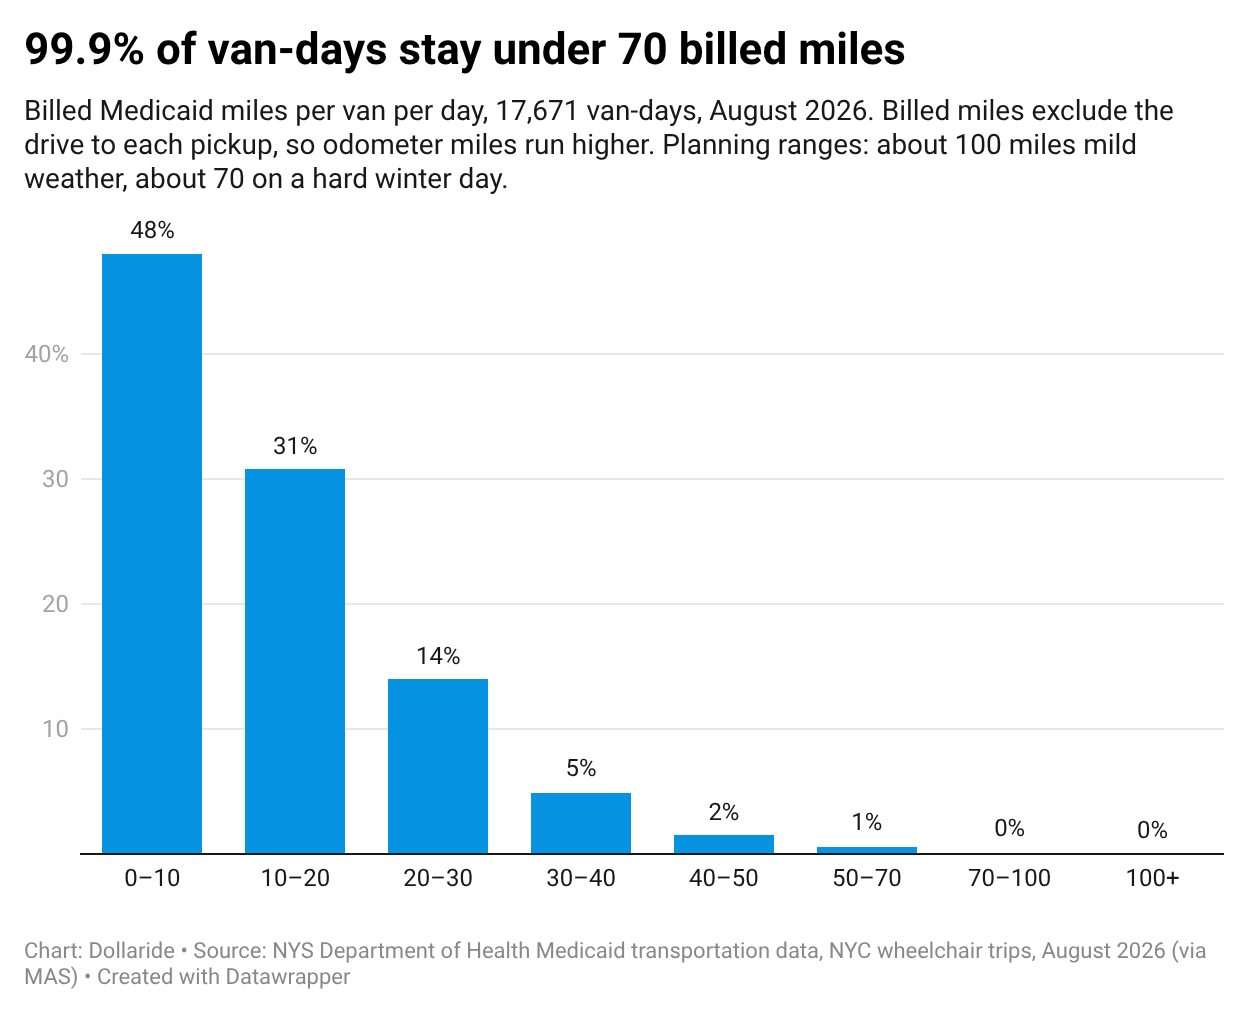
Sources: Ford E-Transit targeted range (automotive-fleet.com); NYS DOH Medicaid transportation data, August 2026. Billed miles leave out the drive to each pickup, so real odometer miles run higher. That is why the next section uses a real fleet's odometer.
Meet Green Trips
Green Trips is a Queens ambulette company that has run Medicaid wheelchair trips since 2016. Based in Whitestone and dispatched through Medical Answering Services (MAS), the state's Medicaid transportation broker for NYC, it serves Queens and Brooklyn, with Nassau County; dialysis patients are the core of the business. About 20 vans were on Medicaid work in August 2026, with six Ford E-Transits in service through CTAP, 10 under contract, and a stated goal of 50 electric vehicles. August Medicaid pickups: Queens 701 / Brooklyn 181; median leg 2.8 miles.
Each van reports its position, odometer and state of charge to ZetiOS, the telematics and asset management platform behind CTAP. Every mile below comes from that feed.
Sources: Green Trips; NYS DOH Medicaid transportation data, August 2026.
30 days, six vans, every mile tracked
Sep 5 – Oct 4, 2026. Six E-Transits. 150 van-days.
- Longest day on record: 128 miles. 24 van-days ran past 100 miles; 7 ran past the 116-mile standard-range figure. Every one finished the route; those days included a mid-day top-up.
- The 100-mile line is the planning range we quote for a mild-weather day. Most days sit well under it; the days above it show what a quick mid-day charge buys.
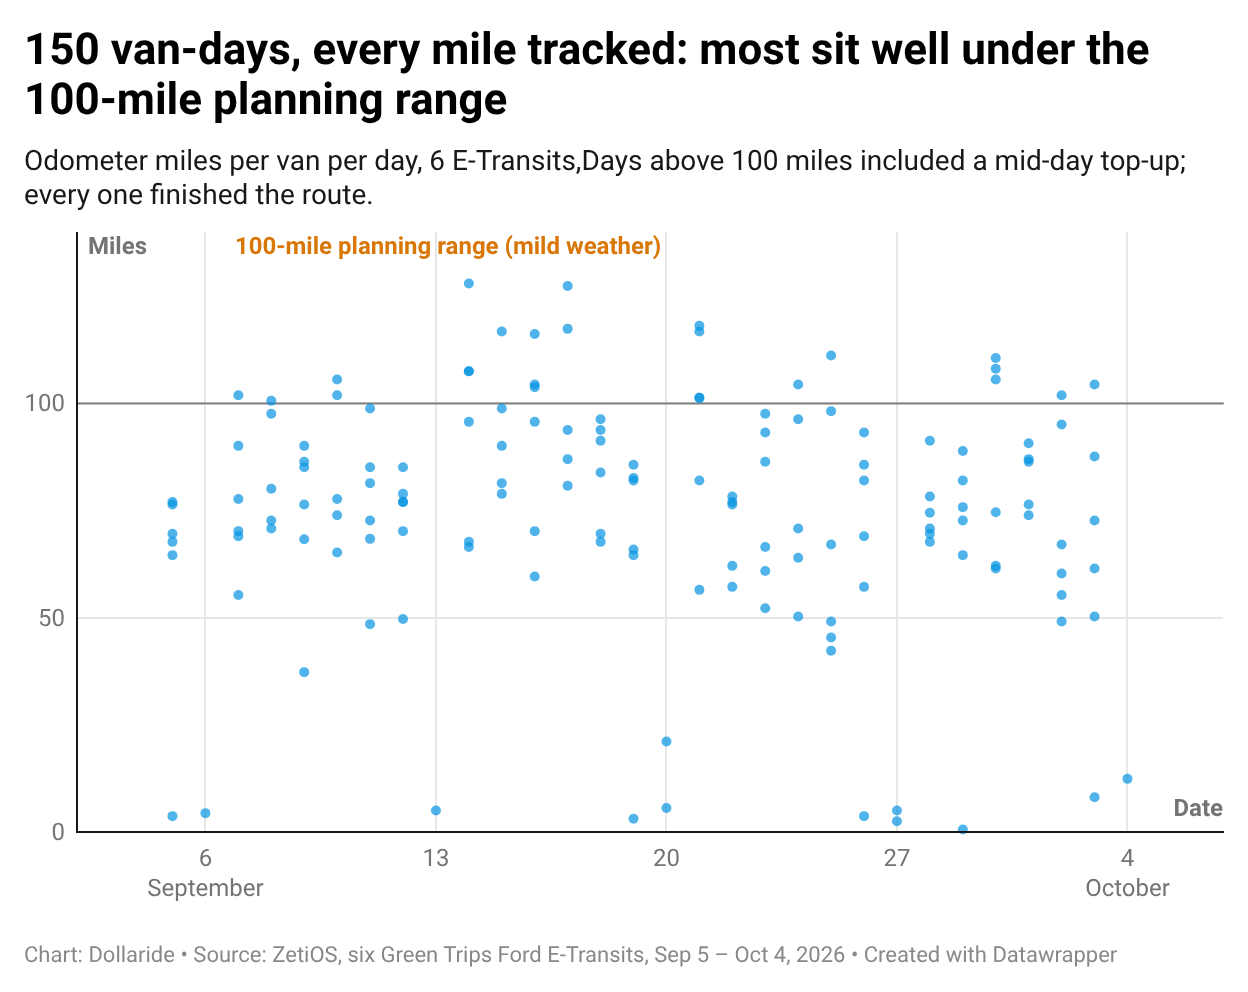
Source: ZetiOS trip history, six Green Trips E-Transits, Sep 5 – Oct 4, 2026.
Charging fits the schedule
148 charging sessions in 30 days. Most of them after the last drop-off. 96% DC fast charging at three sites inside the service area: Whitestone (72 sessions), Glen Oaks (43), Elmont (27). A typical session ran about an hour and ended near 96%. 64 of 148 sessions started between 7 and 10 PM, with a second, smaller cluster from 3 to 8 AM before the first pickup. Charging and parking are part of the CTAP package, so the operator isn't hunting for a plug.
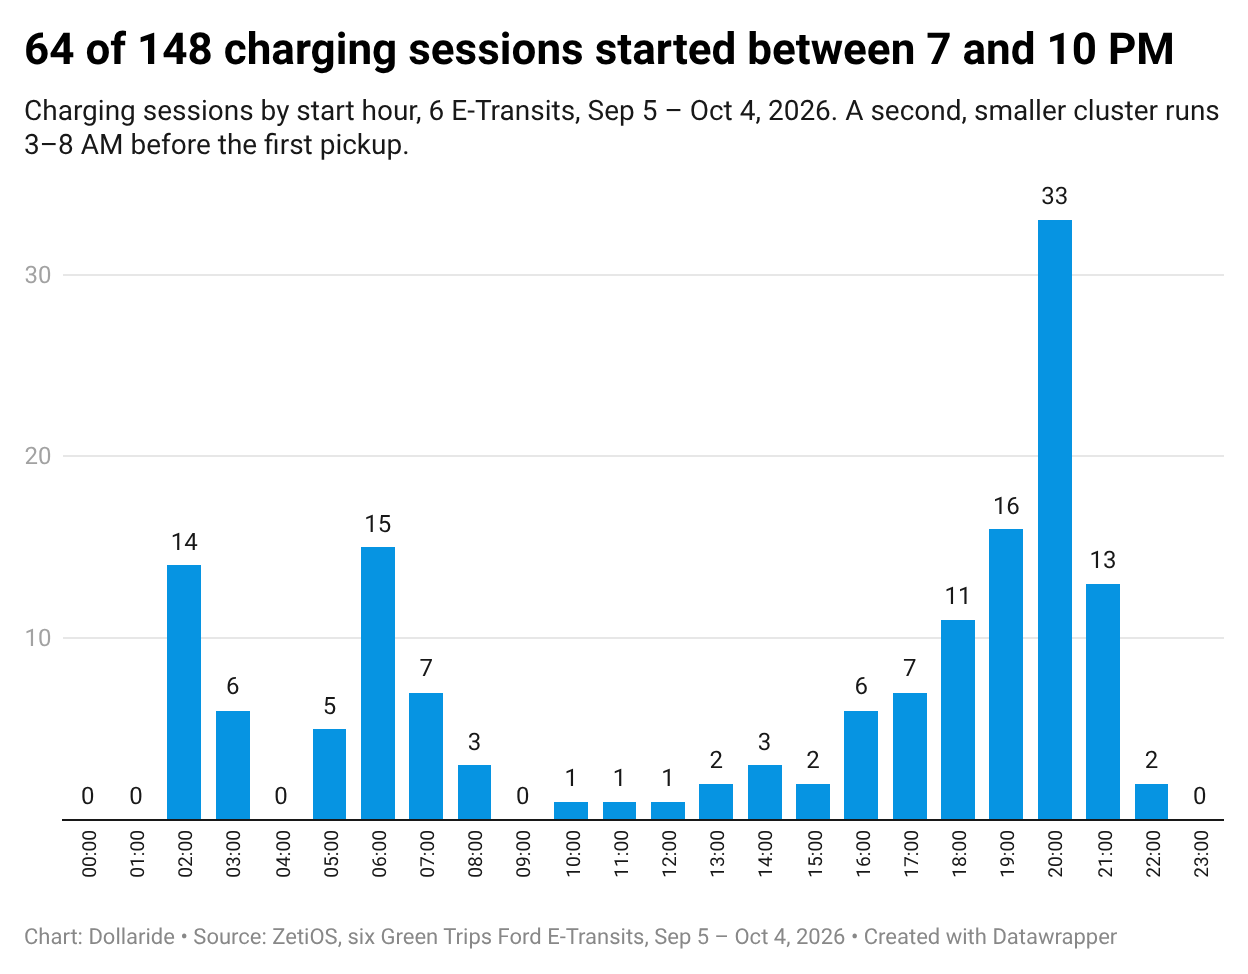
Source: ZetiOS charge insights, Green Trips, Sep 5 – Oct 4, 2026.
Winter, and the headroom that's left
These are mild-weather numbers. Winter will take a bite. The math still works. Cold cuts electric range; in AAA's 2019 test, running the heater at 20°F cut passenger-car range by 41%. Treat it as a rough guide for a van.
- Green Trips' average day: 73 miles. Hard-winter planning range: about 70 miles, with a lift, heat and an aging battery already in the plan.
- Busiest van: 91 miles a day. On a hard winter day it plugs in once at midday, or charges full every night.
- The wheelchair lift, the climate control and the stop-and-go are already inside the fleet's 2.07 miles per kWh.
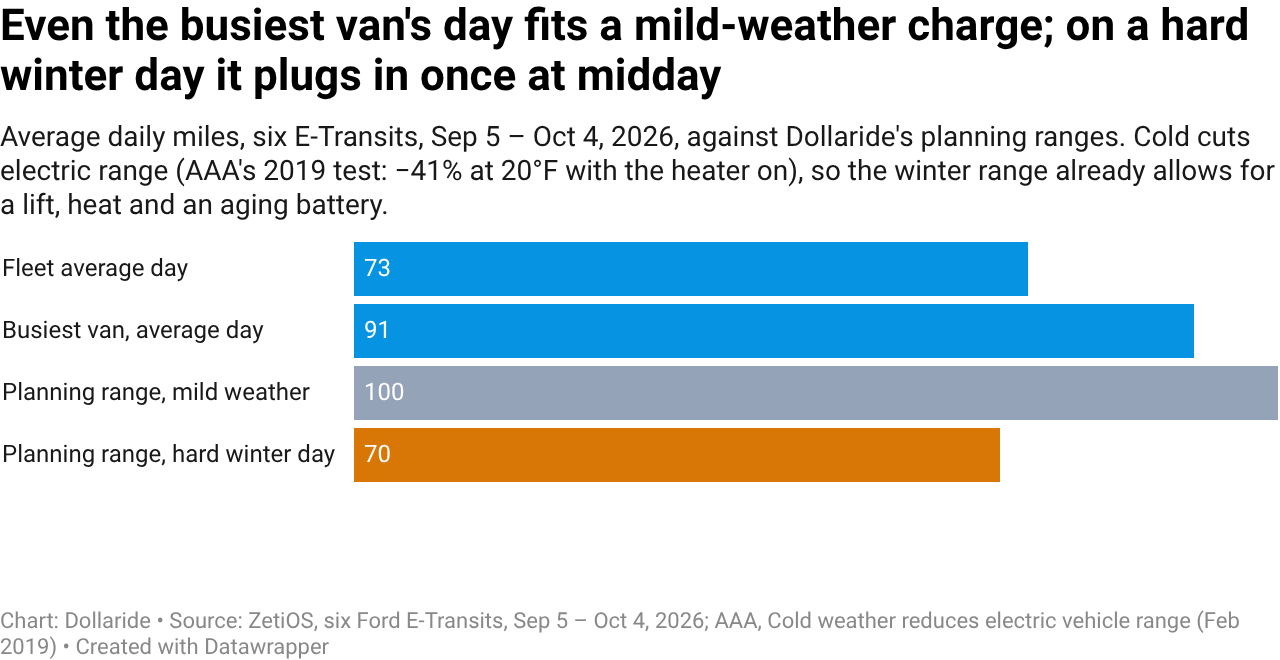
Sources: AAA, "Cold weather reduces electric vehicle range" (Feb 2019); ZetiOS, Green Trips, Sep 5 – Oct 4, 2026.
What it costs to move
Electric: about $0.19 a mile. Gas, same van, same roads: about $0.31.
- 5,851 kWh bought at the three CTAP charging sites in 30 days: about $2,300 at posted time-of-day rates, $0.40 per kWh blended; half of it off-peak at $0.29 – $0.30.
- $0.19 per mile blended at 2.07 miles per kWh; $0.14 off-peak, $0.28 at the peak rate.
- $0.31 per mile for a gas Transit at 14.2 mpg and New York's $4.47 regular price.
- Roughly $2,900 a year per van in fuel alone on this fleet's 75 miles a day, six days a week; $4,100 if charging stays off-peak.
- Fuel is one line of the $3,000 – $12,000+ per vehicle per year operators on CTAP see, depending on utilization. NEMT fleets running full days land near the top, nearly $10,000 a year per vehicle with insurance, financing, parking and charging counted.
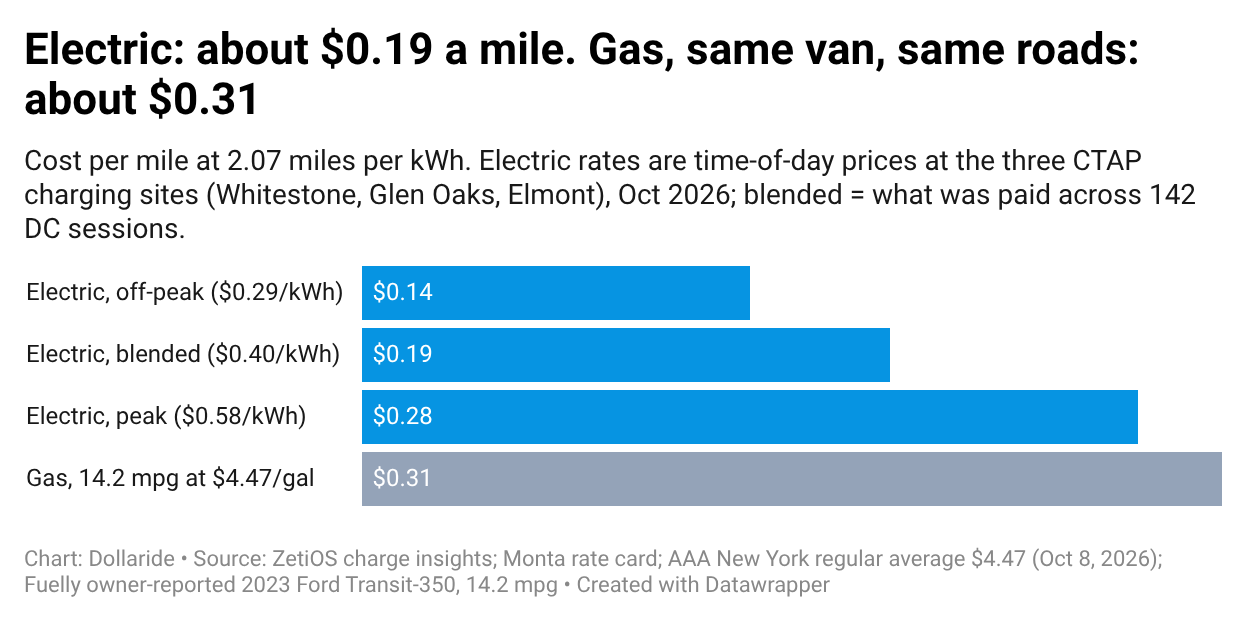
Sources: ZetiOS charge insights, Sep 5 – Oct 4, 2026; Monta rate card, Whitestone / Glen Oaks / Elmont (Oct 2026); AAA New York regular average $4.47 (Oct 8, 2026); Fuelly owner-reported 2023 Ford Transit-350, 14.2 mpg. Cost = session kWh × rate for the session's start-time band; six Level 2 sessions at Green Trips' own lot excluded. Miles per kWh uses energy consumed; on energy charged it is 1.84. Maintenance stays with the operator.
Emissions
About 4.6 metric tons of CO₂ avoided in 30 days, a 66% cut against the same miles on gas.
- Gas baseline: 11,204 miles at 14.2 mpg = 789 gallons × 8,887 g CO₂ per gallon (EPA).
- Electric: 6,076 kWh charged × EPA eGRID2023 NYC/Westchester rate, 864 lb CO₂ per MWh.
- Tailpipe-free in the neighborhoods the vans serve.
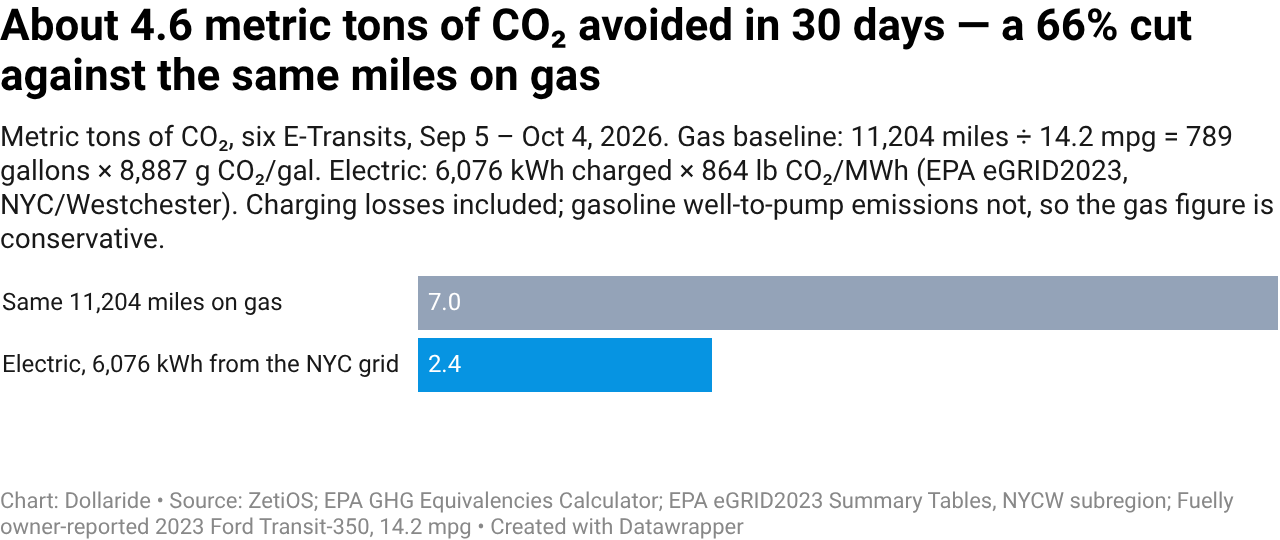
Sources: ZetiOS trip history and charge insights, Sep 5 – Oct 4, 2026; EPA GHG Equivalencies Calculator (gasoline); EPA eGRID2023 Summary Tables, NYCW subregion. Grid emissions counted on kWh charged, including charging losses (on kWh consumed: 4.9 t). Gasoline well-to-pump emissions not included, so the gas baseline is conservative.
In their words
For Green Trips, the vans were never the constraint. People were.
"If I had more drivers, I would want to have 50 vehicles. That's the difficulty in this job. Drivers. It's not the vehicles… I have good credit, so I can get financing. I had up to 40-something cars, but…drivers, drivers, drivers."
— Peter Kim, President, Green Trips Inc. (December 2025)
The full CTAP package takes the vehicle, charging and parking off the owner's plate. That frees the owner's hours for the real hurdle: finding drivers, getting new ones trained, and treating good drivers well enough to keep them.
See whether your routes fit an electric van
Dollaride runs the Clean Transit Access Program (CTAP), funded by NYSERDA ($10M): battery-electric vehicles for NYC passenger fleet operators on a subsidized lease, with vehicle, charging and parking together. No upfront capital required; the NYSERDA incentive is built into the monthly rate.
Book a 30-minute introduction Learn more about CTAP Download the PDF